TRACTOR: Traffic Analysis and Classification Tool for Open RAN
Acknowledgement:
- The dataset collection and public release effort was funded through # 2120447 Collaborative Research: CCRI: New: RFDataFactory: Principled Dataset Generation, Sharing and Maintenance Tools for the Wireless Community.
- The technical work on Open RAN that utilized the dataset was funded through # 2112471
- AI Institute for Future Edge Networks and Distributed Intelligence (AI-EDGE).
Download our dataset and code:
Our codebase and dataset are avaiable on our TRACTOR github repository. Specifically, the original 5G traces are found in the /raw/ directory. The logs containing the O-RAN KPIs used in the TRACTOR paper are found in the /logs/SingleUE/ directory.This dataset was used for the paper "TRACTOR: Traffic Analysis and Classification Tool for Open RAN" published at the IEEE International Conference on Communications (ICC), June 2024. Please use this link to download the paper.
An extended journal version of this work, which involves optimizing resource allocation after traffic classification, is under review. The publicly released ArXiv version of the paper can be downloaded using this link . We have open-sourced our comprehensive O-RAN Dataset which can be accessed from this repository .
Any use of this dataset which results in an academic publication or other publication which includes a bibliography should include a citation to our paper. Here is the reference for the work:
Abstract:
5G and beyond cellular networks promise remarkable advancements in bandwidth, latency, and connectivity. The emergence of Open Radio Access Network (O-RAN) represents a pivotal direction for the evolution of cellular networks, inherently supporting machine learning (ML) for network operation control. Within this framework, RAN Intelligence Controllers (RICs) from one provider can employ ML models developed by third-party vendors through the acquisition of key performance indicators (KPIs) from geographically distant base stations or user equipment (UE). Yet, the development of ML models hinges on the availability of realistic and robust datasets. In this study, we embark on a two-fold journey. First, we collect a comprehensive 5G dataset, harnessing real-world cell phones across diverse applications, locations, and mobility scenarios. Next, we replicate this traffic within a full-stack srsRAN-based O-RAN framework on Colosseum, the world's largest radio frequency (RF) emulator. This process yields a robust and O-RAN compliant KPI dataset mirroring real-world conditions. We illustrate how such a dataset can fuel the training of ML models and facilitate the deployment of xApps for traffic slice classification by introducing a CNN based classifier that achieves accuracy \( >95\% \) offline and \( 92\% \) online. To accelerate research in this domain, we provide open-source access to our toolchain and supplementary utilities, empowering the broader research community to expedite the creation of realistic and O-RAN compliant datasets.

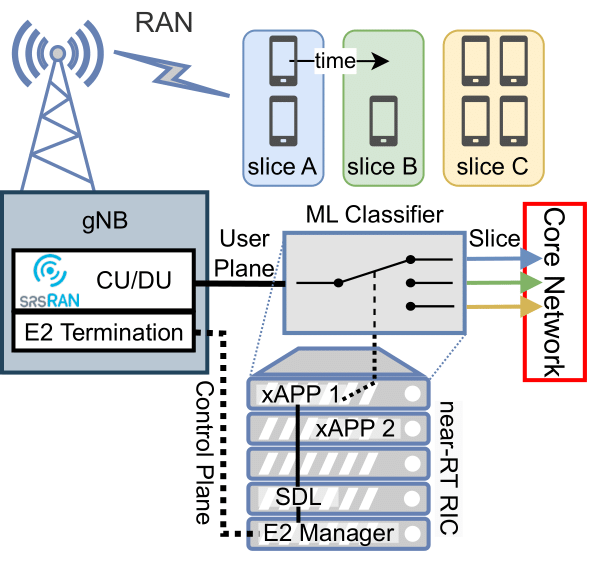
Fig. 1: O-RAN system used in TRACTOR.

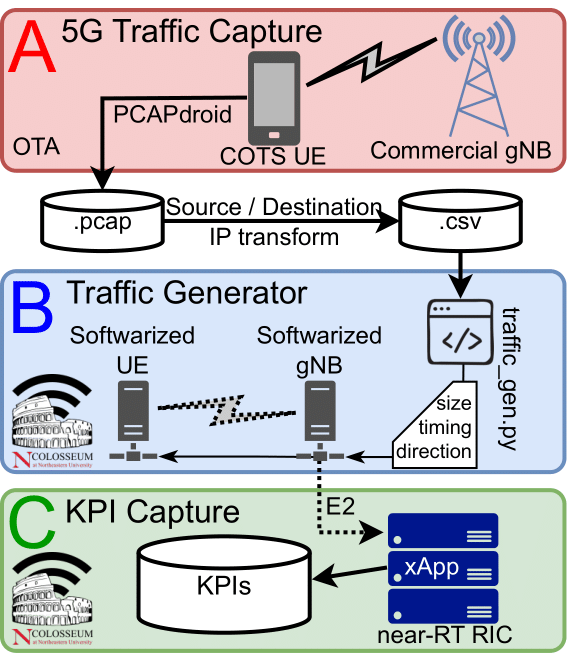
Fig. 2: Process to create an O-RAN compliant dataset.

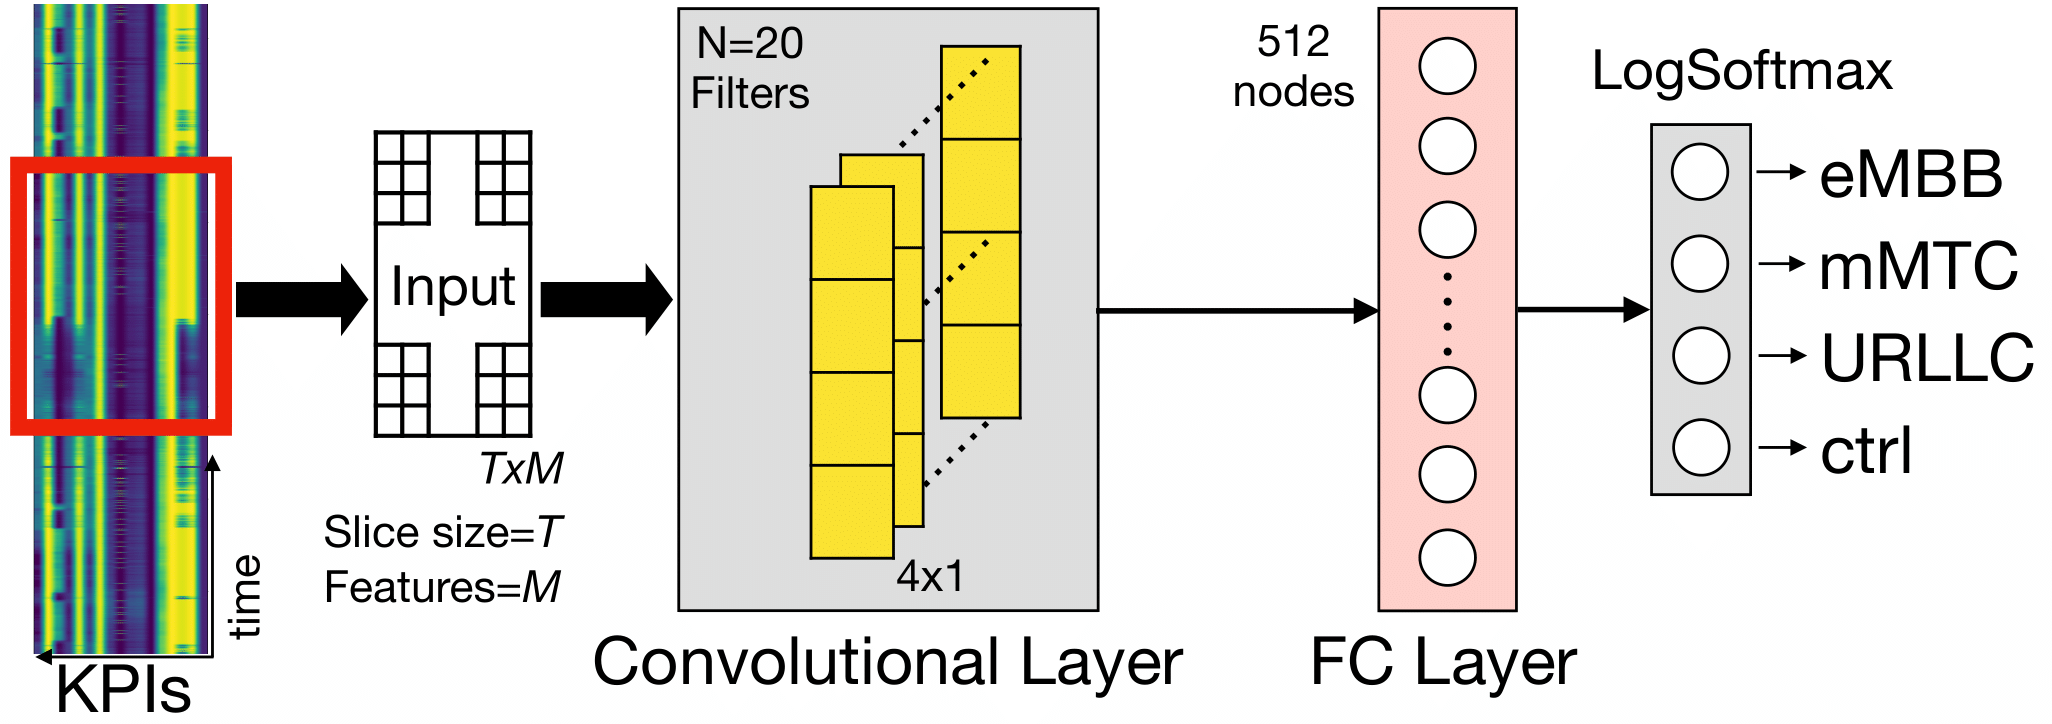
Fig. 3: ML model used for traffic classification in the TRACTOR framework.
Dataset Description:
Collecting Real-World 5G User DataTo collect real-world 5G user traffic, we use the open source PCAPdroid Android application on a Google Pixel 6 Pro smartphone and generate packet captures (.pcap files) of user traffic. This is illustrated by block A in Fig. 2. We use a variety of applications for each network slice. For eMBB, we stream videos, browse the Internet, and transfer large files. For URLLC, we conduct both voice phone calls, video chat, and utilize real time AR applications. For mMTC we capture texts and background traffic from all apps when the phone is not actively being used. This is not the typical example of mMTC traffic, such as IoT applications. However, it does fit nicely in the fundamental definition of mMTC because it is low throughput, latency tolerant communication from numerous applications. PCAPdroid provides a custom trailer that adds metadata identifying the phone application to each packet capture. This data is used to ensure captured data is labeled with the correct network slice. This large dataset was collected on multiple different days, in different locations, with different levels of mobility. The Table below gives a detailed overview of the parameters used to capture 447 minutes of 5G traffic. These original 5G traces are found in the /raw/ directory in the TRACTOR Github repository.
| Slice | Application | Location | Mobility | Time (min) |
|---|---|---|---|---|
| eMBB | Chrome, YouTube, One Drive | Residential | Stationary | 43.5 |
| eMBB | YouTube | Campus | Stationary | 29.0 |
| eMBB | YouTube | Campus | Stationary | 17.2 |
| eMBB | Netflix | Campus | Stationary | 21.3 |
| eMBB | One Drive | Campus | Stationary | 30.6 |
| eMBB | YouTube | Campus | Stationary | 4.9 |
| eMBB | Pandora | Campus | Stationary | 6.7 |
| eMBB | One Drive | Campus | Stationary | 1.1 |
| eMBB | Chrome | Campus | Stationary | 5.7 |
| mMTC | background | Mixed | Driving | 64.0 |
| mMTC | background | Campus | Walking | 11.8 |
| mMTC | background | Campus | Stationary | 23.7 |
| mMTC | background | Campus | Stationary | 23.9 |
| mMTC | background | Campus | Stationary | 16.4 |
| mMTC | background | Campus | Stationary | 5.6 |
| mMTC | background | Campus | Stationary | 20.9 |
| URLLC | Google Meet | Campus | Walking | 57.0 |
| URLLC | Phone, Google Meet | Residential | Walking | 5.8 |
| URLLC | Google Meet | Campus | Stationary | 8.0 |
| URLLC | Facebook Messenger | Campus | Stationary | 21.0 |
| URLLC | Google Meet | Campus | Walking | 7.9 |
| URLLC | Google Meet | Campus | Stationary | 7.1 |
| URLLC | Google Maps Live View AR | Campus B | Walking | 6.5 |
| URLLC | Facebook Messenger | Campus | Stationary | 3.9 |
| URLLC | Microsoft Teams | Campus | Stationary | 3.5 |
To capture KPIs, we employ the TRACTOR xApp, which retrieves requested KPIs from the gNB every \( 250\mathrm{ms} \) over the E2 interface. This xApp uses our ML model for online traffic slice classification. Simultaneously, we record all the available KPIs for offline training. These KPIs are stored in a .csv file and are part of our publicly accessible dataset. The process is depicted in block C of Fig. 2.
In our O-RAN setup, we have access to 31 KPIs listed here that cover various low-level performance metrics and include some identifiers like IMSI, RNTI, and slice ID. Before inputting these KPIs into our ML model, we conduct preprocessing to remove KPIs that contain unique identifying information and certain administrative data, such as slice assignments and scheduling policies, to ensure user privacy and confidentiality. Additionally, we exclude KPIs like received signal strength indicator (RSSI) that lack values in our Colosseum emulation, reducing input dimensions without loss of information. The resulting dataset for model training consists of 17 carefully selected KPIs, detailed in the Table below.
| KPI name | Description |
|---|---|
| dl_mcs | Downlink modulation and coding |
| dl_n_samples | Number of download samples in previous 250 ms |
| dl_buffer_bytes | Downlink queue length in bytes |
| tx_brate_downlink_Mbps | Downlink bitrate in Mbps |
| tx_pkts_downlink | Downlink number of packets transmitted in previous 250 ms |
| dl_cqi | Downlink channel quality indicator |
| ul_mcs | Uplink modulation and coding |
| ul_n_samples | Uplink number of samples in previous 250 ms |
| ul_buffer_bytes | Uplink queue length in bytes |
| rx_brate_uplink_Mbps | Uplink bitrate in Mbps |
| rx_pkts_uplink | Uplink number of packets received in previous 250 ms |
| rx_errors_up_perc | Uplink percent of packets with errors in previous 250 ms |
| ul_sinr | Uplink signal to interference and noise ratio |
| phr | UE power headroom |
| sum_reqsted_prbs | Sum of the resource blocks requested in previous 250 ms |
| sum_granted_prbs | Sum of the resource blocks granted in previous 250 ms |
| ul_turbo_iters | Uplink turbo encoding |

